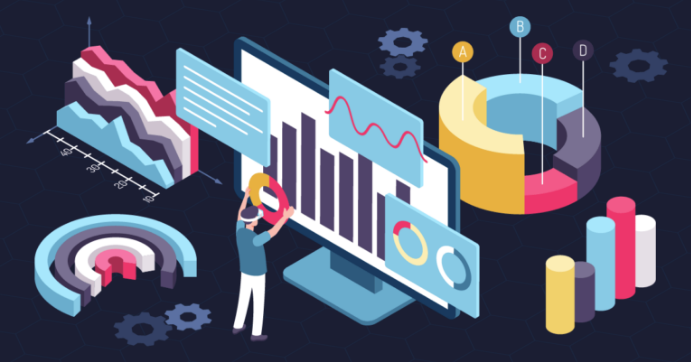
What is Immersive Analytics?
Immersive analytics can be defined as the utilization of new immersive systems and display technologies such as but not limited to Virtual, Augmented, and Mixed reality to help individuals and organizations make sense of their data. The importance of data to individuals and organizations alike cannot be underestimated, a survey from Deloitte notes that: “49 percent of respondents said analytics helps them make better decisions, 16 percent say that it better enables key strategic initiatives, and 10 percent say it helps them improve relationships with both customers and business partners”.
How data is collected, stored, managed, processed, and displayed makes a lot of difference in aiding analytical thinking and decision-making, with just a two-dimensional computer screen and even data printed on paper many companies are able to display useful data and established a reasonable understanding, but, with the use of Large touch surfaces, immersive virtual and augmented reality settings, haptic and acoustic displays, and other immersive analytics tools a deeper understanding and analysis of data is set to emerge.
Why immersive human-computer interfaces are better?
Immersive human-computer interfaces are interfaces that heavily involve users by immersing them through additional or more-immersive displays and user interface techniques both conceptually and perceptually, Immersion is present in all computing systems that allow human input and output, but immersive analytics utilizes systems that are more immersive than an average computing system, by 2022 standard at least because no one knows how immersive the average systems of the future would be, I don’t doubt an average computer system of 2050 may be more immersive than one of the best consumer-focused VR headset if 2022, The Oculus Quest 2, as of now though I won’t say an average personal computer can be classified as an immersive interface, not by my personal definition. There are certain attributes and things that immersive human-computer interfaces offer over normal computer interfaces that make them more immersive than the average computing interface. Some of which are:
1. Support for additional input methods such as:
- Biokinetic tracking and input: input from various body parts.
- Natural manipulation (e.g., directly touching/grasping/moving data with the hand)
- Voice inputs
2. Support for additional channels of sensory output such as:
- Haptic feedback
- Taste display
- Olfactory display
- And many more
3. Ability to reproduce existing sensory output channels with improved fidelity:
- Stereoscopic (3D) visual display: a display device capable of conveying depth perception to the viewer by means of stereopsis.
- Spatialized sound display: A three-dimensional audio output.
- Large visual display – substantially more than 30° Field of View (The wider the field of view, the more present the user is likely to feel in the experience)
These attributes and more allow organizations and individuals to interact with data in new ways, ways previously unimaginable introducing new dimensions to analytical reasoning and enhancing decision-making.
Exploring a real-life example
Citi collaborates with 8ninths to create a Holographic Workstation for Financial Trading using Microsoft Hololens in March 2016.
This video provides a glimpse into the world of immersive analytics at its early stages.
The Problem: Financial traders’ current workstations provide an abundance of data, but in formats that are difficult to process and prioritize—long streams of figures on multiple monitors, each representing something different.
The Concept: 8ninths teamed up with the Citi Innovation Lab to develop a Proof of Concept illustrating how mixed reality is the next game-changing technology for finance. The goal was to explore the ramifications and possibilities of mixed reality in the world of financial trading – This would later lead to the Holographic workstation, an important example that provides a glimpse into the world of immersive analytics.
The Solution Created: They used a combination of 2D and 3D presentations of data to immerse the trader in the abundance of available data, optimizing the trader’s ability to extract meaning from the information, quickly and accurately. They are increasing efficiency while reducing time, cost, and the cognitive load of working with abstract data, leading to the creation of the Holographic Workstation — a new paradigm that has ramifications far beyond the world of finance to information workers of all kinds.
Some of the focus areas covered during the making of the Holographic workstation were very interesting. I would advise you to learn more about how this beautiful solution was designed and some of the challenges faced.
Conclusion:
With a deeper understanding of immersive analytics and its predicted and observed impact in influencing decision-making and analytical thinking, it is clear that this is already a game-changer in the area of data analysis. Immersive human-computer interfaces offer new and unexplored ways to interact with and understand data with things like sensory and haptic feedback, introducing new dimensions to analytical reasoning and enhancing decision-making. I am excited to see where this goes and how it would change the world of data analysis and hope to write more on it soon.
Until next time, keep learning!
Bibliography:
Immersive Analytics: Theory and Research Agenda – PMC
Citi Holographic Workstation for Financial Trading – 8ninths